Configuring the Diagnostics System
The diagnostics system profile provides options for configuring:
General Settings

Show Diagnostics
Indicates whether or not the diagnostics system is to display the configured diagnostic options.
When disabled, all configured diagnostic options will be hidden.
Programmatically controlling the Diagnostics System
It's also possible to toggle the visibility of the diagnostics system and the profiler at runtime. For example, the code below will hide the diagnostics system and profiler.
if (MixedRealityServiceRegistry.TryGetService<IMixedRealityDiagnosticsSystem>(out var service))
{
    service.ShowDiagnostics = false;
    service.ShowProfiler = false;
}
Profiler Settings
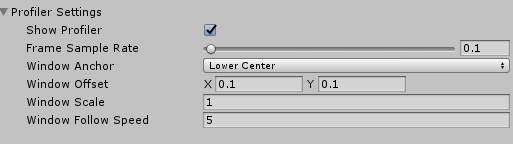
Show Profiler
Indicates whether or not the Visual Profiler is to be displayed.
Frame Sample Rate
The amount of time, in seconds to collect frames for frame rate calculation. The range is 0 to 5 seconds.
Window Anchor
To what portion of the view port should the profiler window be anchored. The default value is Lower Center.
Window Offset
The offset, from the center of the view port, to place the Visual Profiler. The offset will be in the direction of the Window Anchor.
Window Scale
Size multiplier applied to the profiler window. For example, setting the value to 2 will double the window size.
Window Follow Speed
The speed at which to move the profiler window to maintain visibility within the view port.